Interpreting seismograms
Seismic data plots (seismograms) provide a visual record of earthquake activity, as well as other vibrations in the earth caused by natural and man-made phenomena. For example, seismographs located near shipping routes are able to detect the passage of freighters and cruise ships. Those near railway lines detect trains as they pass close by. Seismographs in exposed areas, especially along the West Coast, will detect vibrations in the ground caused by high winds. These instruments are sensitive to even the most minute vibrations, and are able to detect signals from earthquakes occuring thousands of kilometres away.
Time Scale
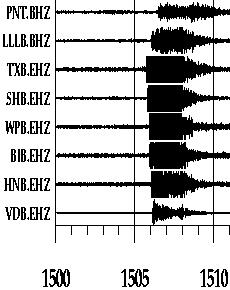
As shown below, each data plot has a time scale associated with it. The starting time for each plot is found in the lower left corner and time increases to the right. The time scale is in Universal Time (also known as Greenwich Mean Time, or GMT). You must subtract 8 hours to get Pacific Standard Time(PST), or 7 hours for Pacific Daylight Time(PDT). You must also consider the date of the plot because 0600 on the 12th of June GMT is 2300 on the 11th of June PDT.

Station Signals

Each horizontal signal line (a "trace") represents the strength, or "amplitude", of the signal received at a single station over the period of an hour. The traces all begin and end at the same time, making it easy for the seismologist to see the difference in time between seismic events at several stations. Each station is part of the Canadian National Seismograph Network and has a unique identifier code of from 3 to 5 letters. For example, PNT is the station code for Penticton, BC. BIB is Bowen Island, BC. For the seismic plots there is a 3 letter code added to the station suffix code that tells the seismologist information about the characteristics of the seismograph signal. For example, ".BHZ" indicates a broadband, high gain seismograph that is oriented on the Z axis (which measures the "up and down" motion of the earth). The ".EHZ" code indicates an extremely shortperiod, high gain, Z axis seismograph. All of the signals on the displayed seismic plots have a Z axis orientation so that comparisons are easily made between seismograms. By looking at the time differences between the arrival of the same signal at several stations, and knowing how fast the signal is traveling through the earth's crust, trigonometry can be applied to determine the exact location of the earthquake.
Earthquake Signals

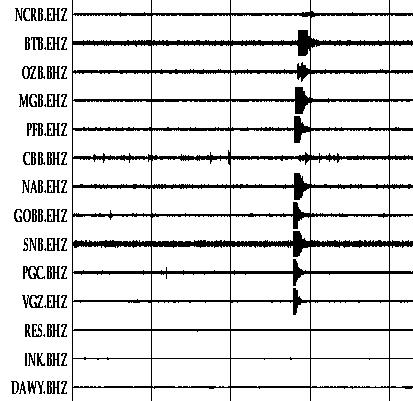
The sample set of signals on the right are those of a small local earthquake. You will notice that the left, or "leading" edge of each "burst" is very square. This indicates that the received signal became very strong in a very short time, which is typical for an earthquake signal. For these plots, the signal amplitude is so high that it reaches the maximum level and is "clipped" so that it looks like it has a flat top. After a while, the signal level begins to fall off as the earthquake energy dissipates gradually over time. Other bursts may appear shortly after the first arrival. These may be aftershocks or they may be other signals from the same earthquake that have travelled more slowly through the earth. There are 2 primary signal types, called S and P waves, and they travel in different ways and at different speeds. How do we know this is a small earthquake? Well, you will notice that the signal was not received on several stations that are farther away. The energy released by the earthquake was not strong enough to travel longer distances, so only those stations close by were able to detect it. You can also see that the signal reached some stations earlier than others. This information will be used to determine the earthquake location.
Other Signal Sources
Seismographs are so sensitive that they can detect very small vibrations in the earth. For example, the CNSN station at Watts Point (WPB), north of Squamish, BC, detects trains as they pass by.
The signal from a train is noticeably different from that of an earthquake because it gradually builds up strength as the trains gets closer, reaches its maximum as the train reaches its "closest point of approach", or CPA, and then gradually diminishes as the train moves farther away. You may also see train signals on station BLBC, near Blue River, BC, that is near the rail lines that connect Vancouver with Edmonton.

Similarly, a large cruise ship generates a lot of vibration in the earth. Our station at Bella Bella (BBB), along the Pacific Coast, receives signals from ships on their way to and from Alaska. The signal has a character that is similar to a train in that it builds gradually to the CPA, then diminishes as it leaves the area. The signal is less steady though so it may have several peaks and valleys throughout. Here is a sample of a ship passing by BBB:

Explosions are also detected by seismographs. Their signals look very similar to earthquakes. Mining and construction activities regularly appear on stations nearby. Here is an example from Texada Island, BC.

Most are very small signals that will be detected by only a few stations in the near vicinity. However, large explosions, such as those from Nuclear Testing, can be detected on a large number of stations. Canada provides seismic data to international organizations engaged in the monitoring of nuclear testing throughout the world.
Another source of noise in the seismic network is wind. Strong winds, like those off the West Coast of BC, can create vibrations that can last for many hours. Our site on the Brooks Peninsula, on the North West side of Vancouver Island, is on a mountaintop that is frequently hit by high winds. Here is a sample of the signal created by wind noise:

System Noise
Signals from the seismic stations make their way to EarthquakesCanada data centres via various electronic means. Essentially, each station has its own computer system that digitizes the data from its seismometer and transmits the digital data via one or more of satellite, terrestrial microwave, UHF radio, telephone modem, or the Internet. If any of the components in the system should fail, or become degraded by atmospheric or other disturbances, there will be a loss of signal or some form of noise introduced. The computer system at the station also calibrates itself whenever it is restarted, which can can generate a strange but easily recognized transient burst:
